Quote:
Originally Posted by semtex

This quote is from the 'other' thread. I'm trying to abide by the efforts at thread consolidation here. 
I think I understand what you're saying, smartbomb, and it's a valid point. There's a difference between deliberate fabrication of numbers vs. 'cherry-picking' the highest ones. That's why I try to show all runs.
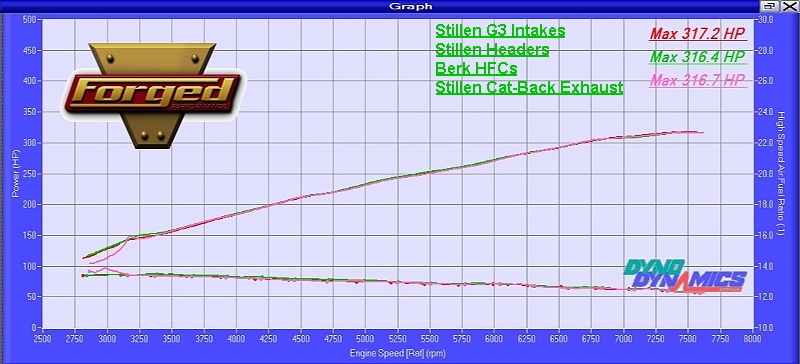
This is the most recent Dyno Dynamics run that I have posted (after installing the Stillen headers):

You can see how close all three runs are.
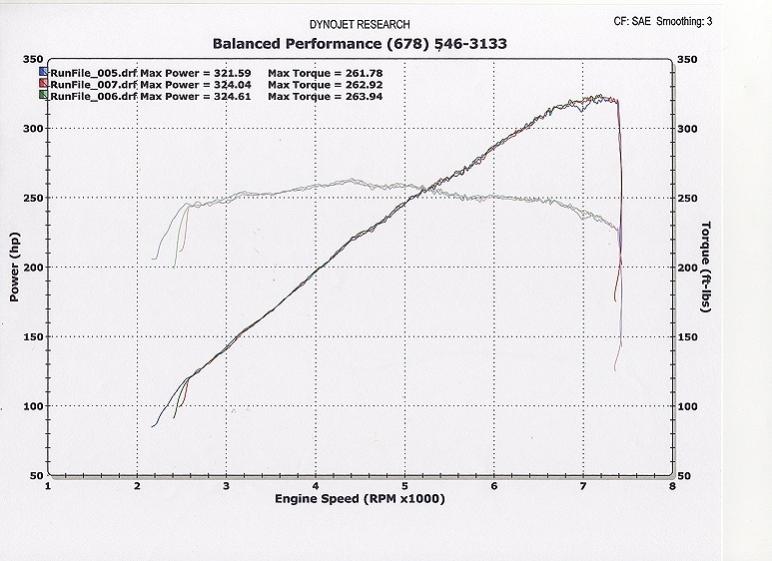
Here's the most recent DynoJet run I have posted (done on same day as above):

Again, you can see the consistency. So in your opinion, is there any inflating of numbers going on here? I suppose technically one could accuse me of cherry-picking because I list the highest of both sets in my signature below. But it's not like I'm taking dynos where I've got three runs with +/- 10whp deltas between each run and only publishing the highest one. And for the record, I don't have sheets from other Dyno Dynamics and DynoJet dynos that I'm suppressing because they came in with lower numbers. I've spent enough coin on dyno sessions as it is!  |
Your results are pretty consistant, I am wondering why the output for the dynojet chart is so noisy with a smoothing factor of 3. Thats what I usualy uses to make it not look so jagged.
What I see is common, (especialy on the SR20 forum) is to do lame stuff like not use SAE correction, then test on a cold day then brag about the numbers while saying that corrected numbers are not real power. I have also seen dishonist shops maunaly screw with the correction and or smoothing numbers to show exagerated power numbers after their tuning or installation of their parts. A common method is to baseline with a high smoothing factor then dyno after tuning with a factor of one which produces higher numbers.