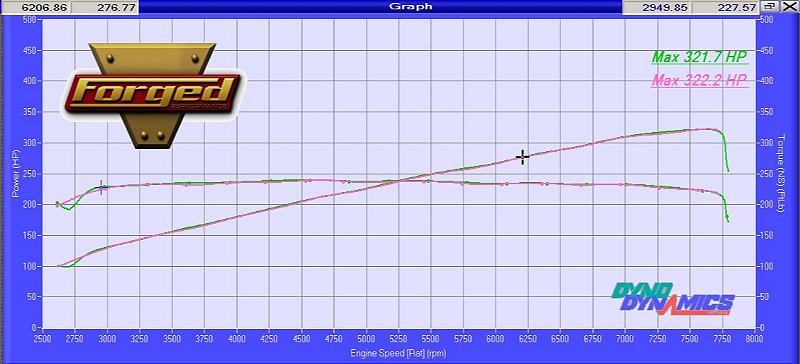
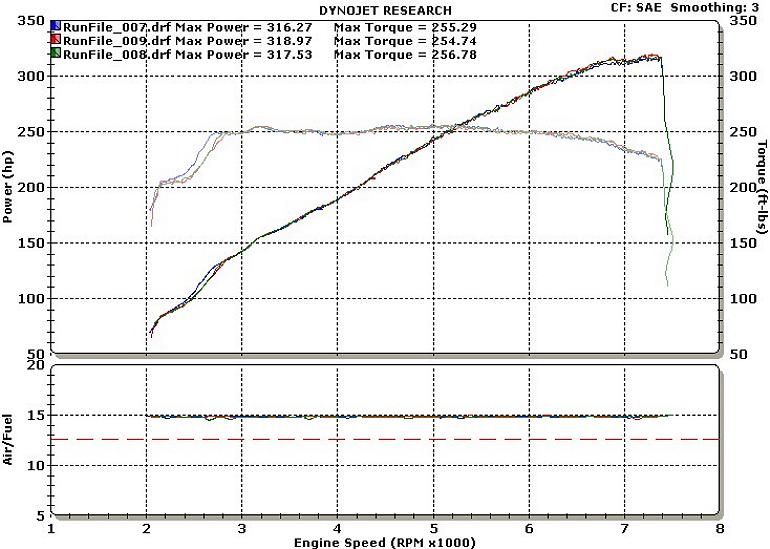
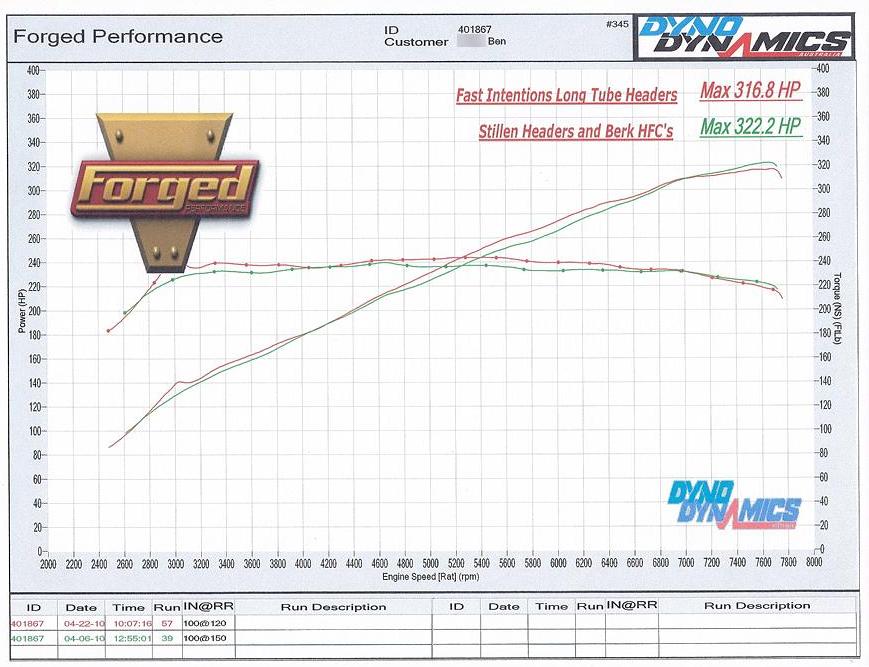
Multiple runs were made, and all of them consistently showed loss of peak hp, as well as the same deltas in the low and mid-ranges. The two lines on the Dyno Dynamics are the best from each session. But within each session, the multiple runs were within +/- 2whp of each other, max. That's how consistently this car dynos. Indeed, you can see this in both the pre-installation dyno charts that I posted, as well as in the DynoJet sheet that I posted.
I'm referring to this one (baseline from 4/7):

And this one (post-installation from 4/23):

If you look at the first one above, the baseline from 4/7, you can clearly see that the two runs are on top of each other. There really is no variation at all. Heck, the peak outputs are just .5whp from one another. But when you overlay the best run from 4/23 on top of the best run from 4/7, that's when you see variation in the low and mid ranges:

Keep in mind though that the dyno is just confirming what I could already feel. The gains aren't monumentally huge or anything; it's not like the effect one feels from installing a turbo. But it is noticeable none the less (to me at least). So I'm quite sure the gains are real. But you're entitled to draw your own conclusions to the contrary if you so choose, obviously. We purposely didn't overlay all the runs from 4/23 over the runs from 4/7 because with so many lines on the graph, it would be just too crowded/cluttered to see what's going on, especially when the gains are so modest. In other words, the deltas are quite small, visually speaking, so they'd be much harder to see if we had like 5 lines on the sheet for hp and another 5 for torque. With the DynoJet run, I had no baseline for comparison, so there was no reason not to display all runs made that day. The purpose of the DynoJet run was just to compare its numbers against those from a Dyno Dynamics dyno.
My car is is a 6MT, to answer your other question.