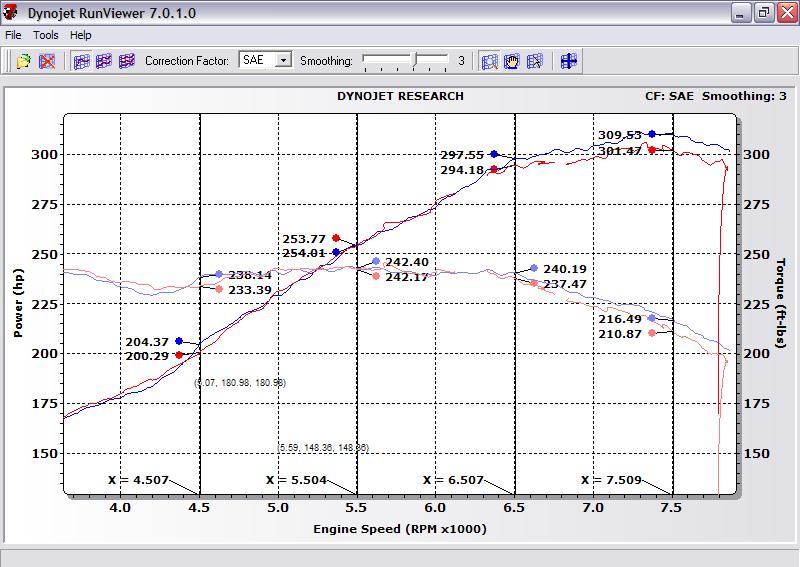
As with before, lets see if we have an accurate baseline as compared to the last PPE Headers dyno.
Again, the 1st PPE measure was taken at Z-fever's in-ground dynojet, whereas the 2nd measure was taken using Proven Power's above ground dynojet. Results are displayed with SAE and STD correction.
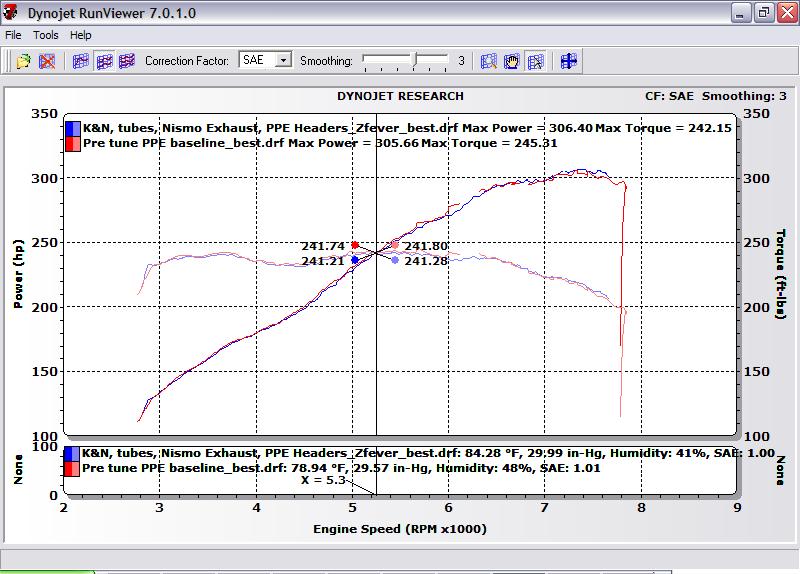
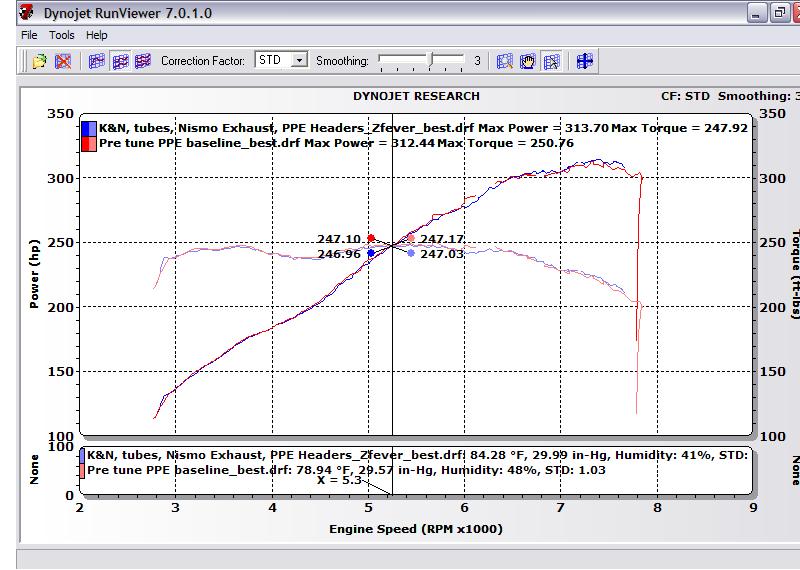
Right off the bat, notwithstanding a little noise due to any number of issues that are tough to perfectly correct for (e.g., weather), we see considerable similarity in the two measures even though they are a week apart and on two different dynojets (the moral here is: a dynojet reading anywhere will always be easier to compare to any dynojet reading anywhere else, which is why I am so vocally pro-dynojet over other dynamometers

)
This also means that, taking the known limitations of correction factors into consideration, we can still make meaningful and informative comparisons between all sorts of set-ups with dynojets.
They should be interpreted with caution, of course, because of the many transient factors that will create variance (even on the same exact dyno on the same day!), but this general consistency will be helpful in making at least tentatively reliable concusions about what a mod does or doesn't do with more confidence than we might comparing, say two different Mustang dynamometer readings or one kind of dynamometer to another different kind

Ok, so that's all well and good -- on to the PPE pre- and post tune results on Proven Power's dyno!
First is a comparison graph with SAE correction, followed by one with STD correction, and then a graph with changes in output noted at 1000 RPM intervals, beginning at 4.5K, SAE corrected. The last one will be my "bragging rights" dyno, STD corrected (remember, STD is kind of an "upper bound"), with no smoothing to unabashedly milk the data for all we can.
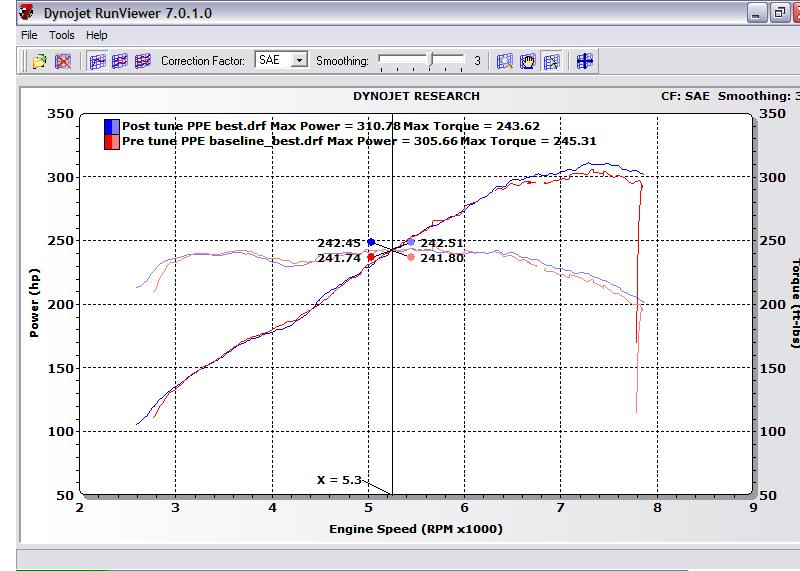
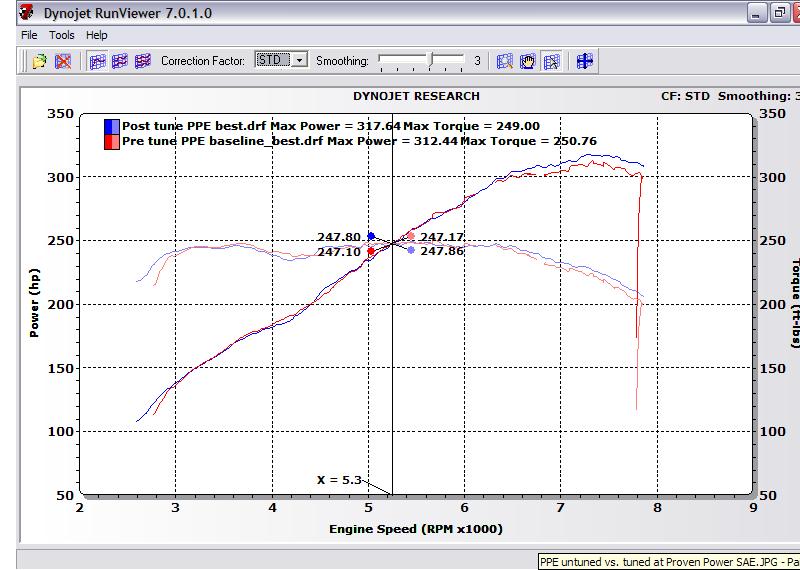
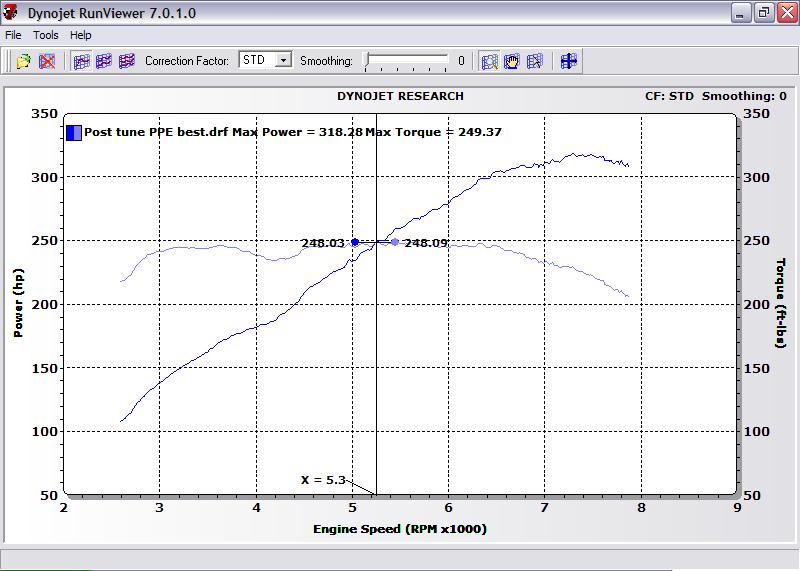
Overall, we see some gains from the last dyno from around 3.25K up and very nice gains higher in the RPM range

Finally, a bit of sad news I see I'm losing some torque between 4 and 4.5K relative to my set-up before the PPE's were installed. Not sure why. This may be a characteristic of the headers on stock VVEL settings (we didn't adjust that yet) or we just need to play with the fueling and spark a bit more there...
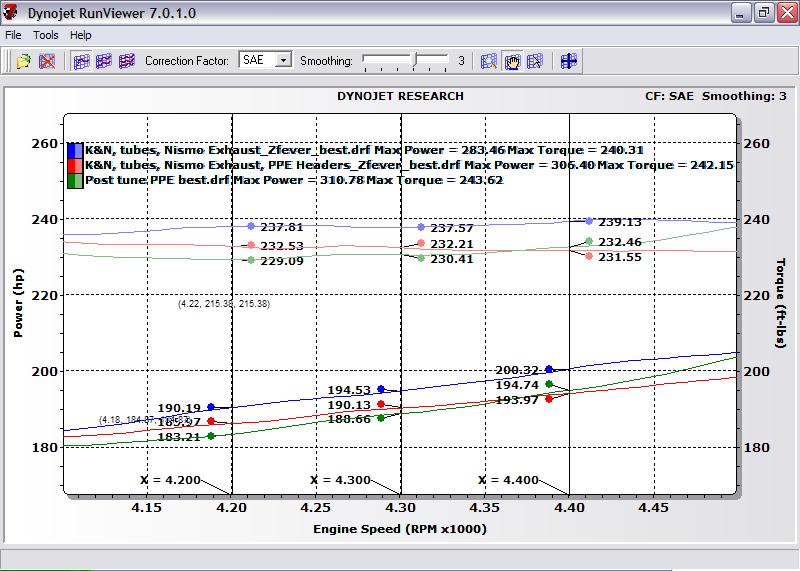
A mystery to be solved another day...
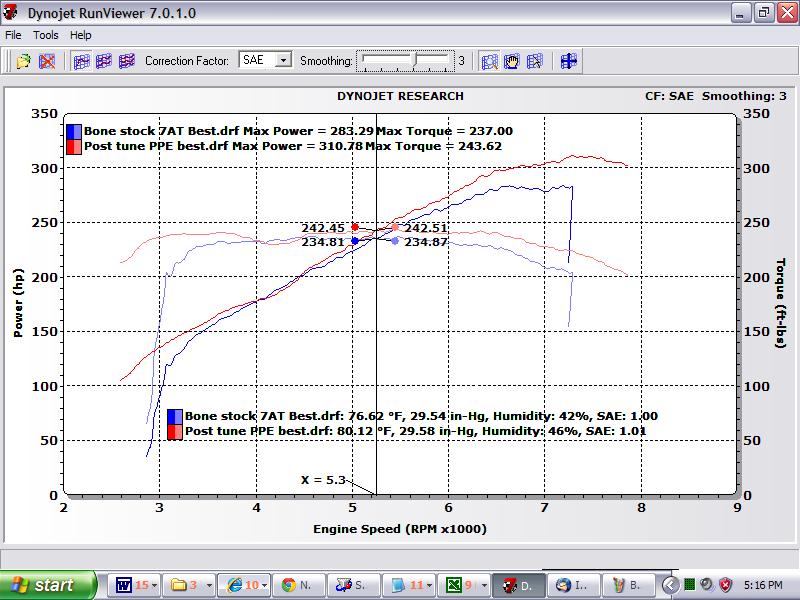
Last, but not least, here are two graphs that compare my 2011 Z bone stock (under similar weather conditions) to now, with all mods + tune.
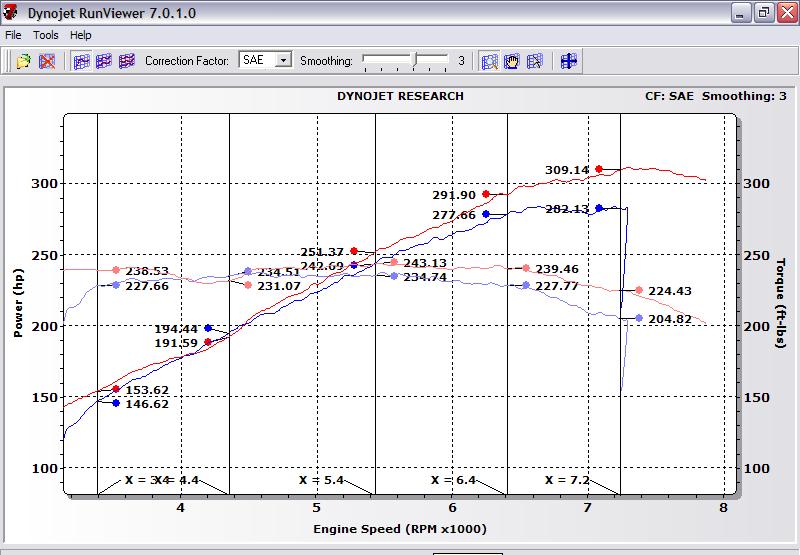
Oh... one more, just for fun: Here is a comparison between my 2010 370Z with resonated TP's and Nismo weldina (Y-pipe version) vs. my 2011 370Z with PPE LTH + Nismo take off (H-pipe version). Both runs are under nearly identical ambient conditions and both have K&N panel filters plus the smooth tubes and a tune.
Because these are technically two different vehicles (although, of course, same engine model and on the same exact dyno...), these results should be interpreted with caution -- but I think are informative, nonetheless.

I think we can tentatively conclude that the PPE LTH + Nismo H-pipe set up is superior up top (a whopping 13 or more whp), but possibly inferior down low (about 5 whp lost in a fairly narrow area) -- further tuning may resolve any apparent losses down low, so we'll just have to wait and see.
That's all for now
