Okay, it's dyno time.
I amend some of my previously noted caveats about the most recent dynoruns a bit; it seems using a different version of Winpep (curiously, an older version...) yielded more interpretable output. Go figure.
First step is to determine the accuracy of the baseline reading. In this context, measurement accuracy refers to repeatablity, meaning we should get the same (or nearly the same) scores across measurement sessions, all else being equal.
However, here we have a problem because even though the mods haven't changed, it's a different dynojet model at a different shop (Z-Fever's in-ground as compared to Proven Power's above ground -- and allegedly, Z-Fever's dyno reads a tad low relative to other dynojets), and the weather was very different (hot August vs. mild November).
So lets compare the last pre-PPE Headers dyno to the most recent.
Below is a comparison of my last dyno at Proven Power vs. my most recent one at Z-fever. Without correction, we see the ugly effects of high heat; with correction (both SAE and STD) we see very similar values and an equivalent overall pattern.
Notwithstanding some pretty sizable variance when torque and horsepower are equal at 5252 RPM (I suspect much of that being due to weather -- see further a few pages back where I showed that even with correction, ambient condition effects are minimized, but still have a profound impact on the obtained results -- meaning no correction factor is perfect), as you can see, even though it is a different dynojet model at a different shop, highly comparable results are obtained after correction.
Without Correction
 With SAE or STD Correction
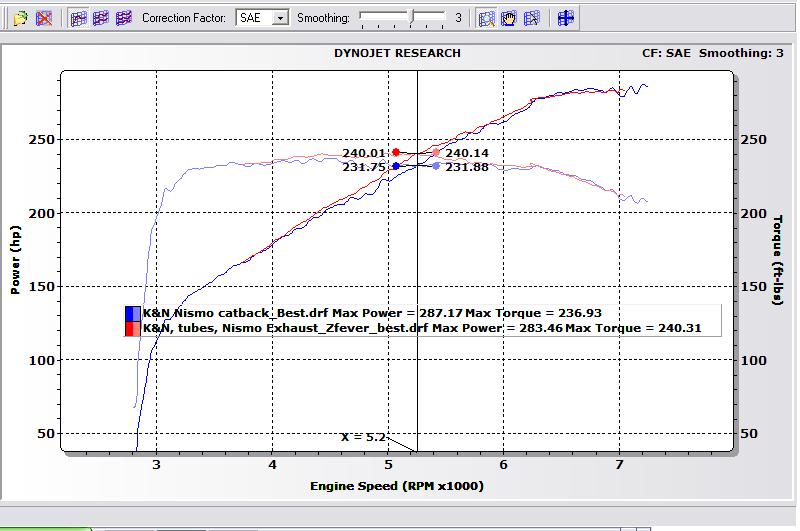
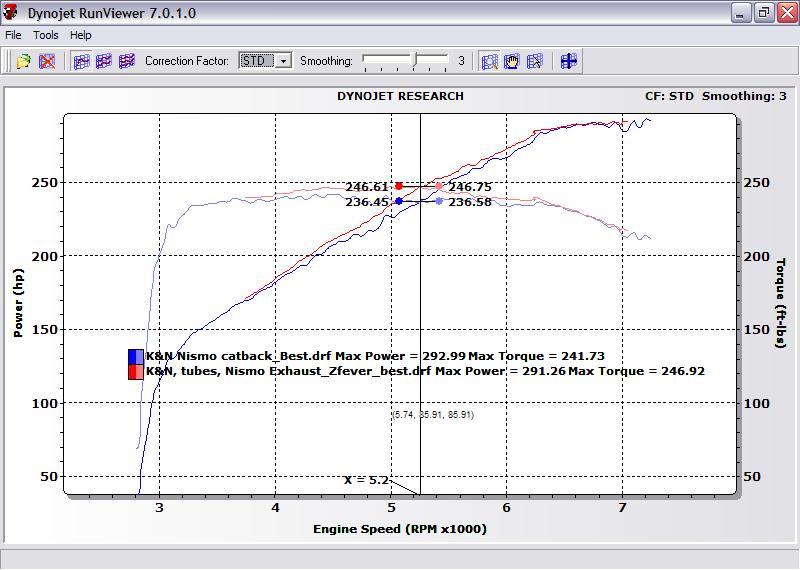
You will notice, as usual, the STD corrected values tend to be higher than the SAE values.
Okay, so the new baseline readings are close to the last readings obtained, so on to the comparison of baseline vs. headers...
First, with SAE correction, here's the new baseline dyno (K&N panel filters, smooth tubes, Nismo catback) vs. PPE dyno (i.e., PPE plus everything else); STD corrected results are reported after that. The last one is STD without smoothing to (shamelessly) milk the data for evidence of gains.
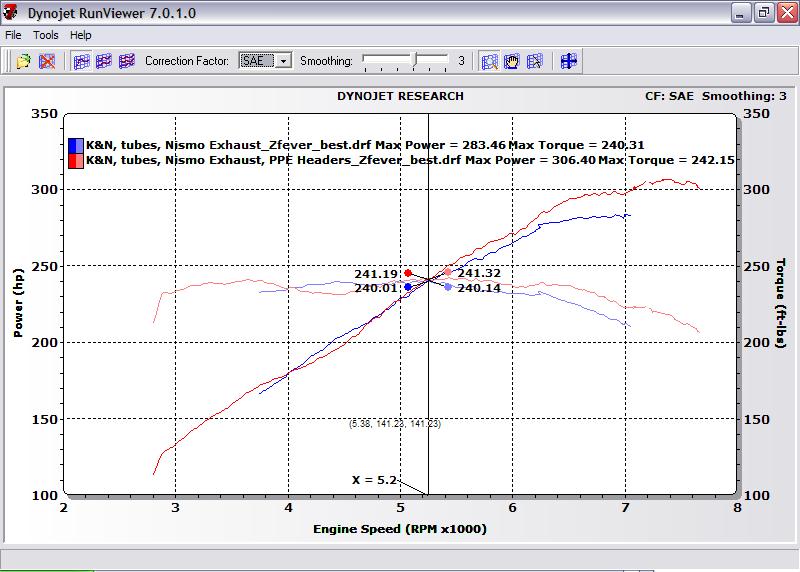
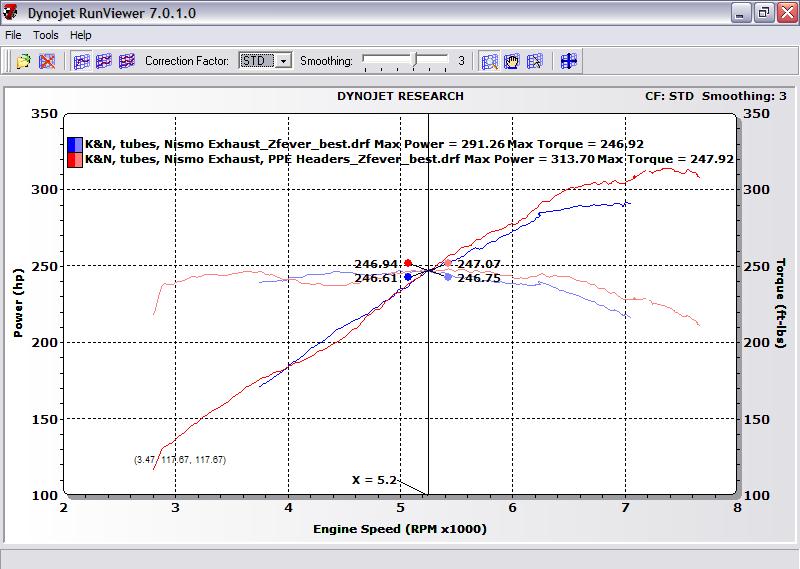
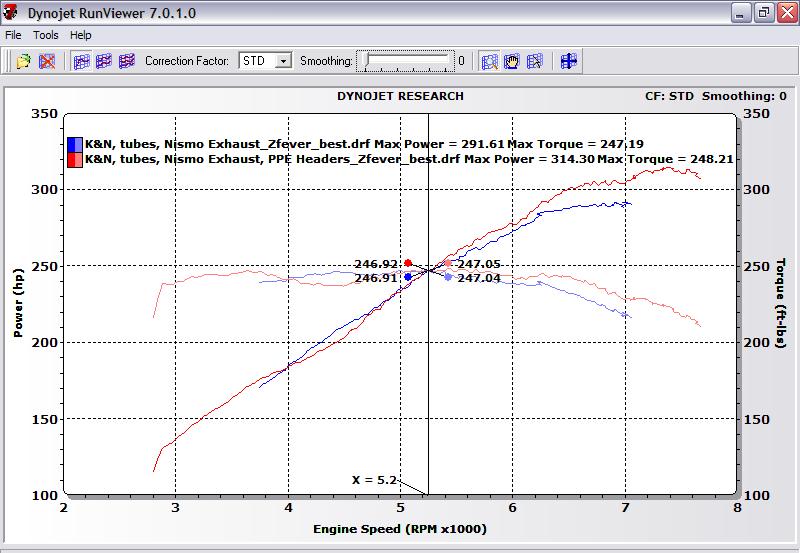
Obviously the advertised "315" that I was told the car had put down was based on the STD values without any smoothing...
Of course,
either correction is perfectly legitimate -- although I personally prefer referring to the under- rather than the overestimate. It might be most meaningful to think of SAE values as a lower bound and STD as an upper bound.
Either way, whichever correction factor you use, the gains are
clearly over 20 whp (as high as 23 whp!), which is in line with expectations. It's a bit more difficult to interpret what's happening with torque (although gains up top are pretty apparent) because of some signal pick-up issues, but overall, it's clear that the PPE's did a nice job bumping up peak power on the Z!
That said, I wouldn't be too concerned with the apparent losses at low RPM's for now -- tuning is yet to happen, and again, there was some glitchiness during measurement, so again, all of these results, while informative are only tentative. The picture will be much clearer after I go to Proven Power and tune the thing next week.
Bearing all of that in mind, here's a nice detailed comparison that shows changes at 500 PRM intervals above 5252.
 Tentative conclusion:
 The PPE headers sound great and make great power, and are therefore a highly worthwhile N/A (or S/C, I should think) mod to consider. They're a bitch to install, but once they're on, you won't be sorry!
Well, that's all for now -- lots more at the end of next week.
