Quote:
Originally Posted by gsxr750

Showing a 2 different graphs to represent HP gains, with different data points on each graph does not provide accurate data, unless you were to overlay the 2 graphs or plot the data points on 1 chart.
If a car makes 200 HP at 4000 rpm. in one chart and in another chart it makes 210 HP at 4200 rpm , you can 't say there was a 10 HP gain between to 2 charts.
Data points between the 2 charts must be identical in order to illustrate an accurate comparison.
|
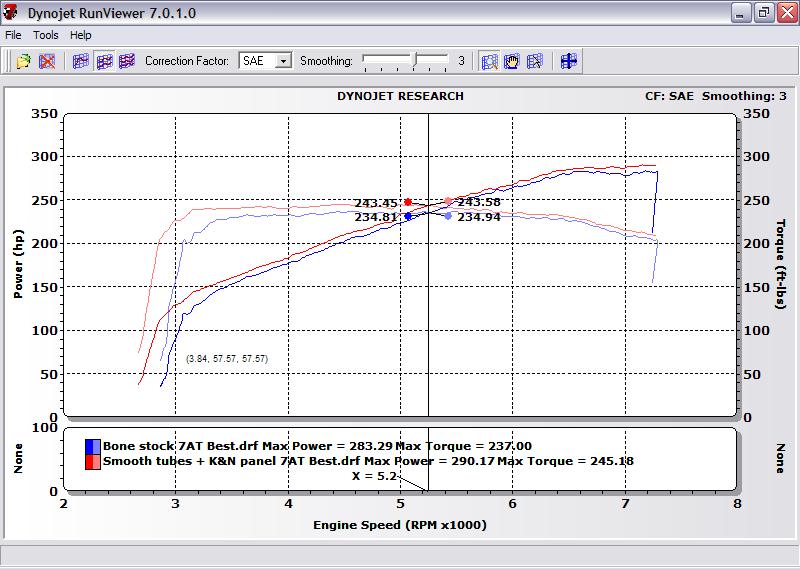
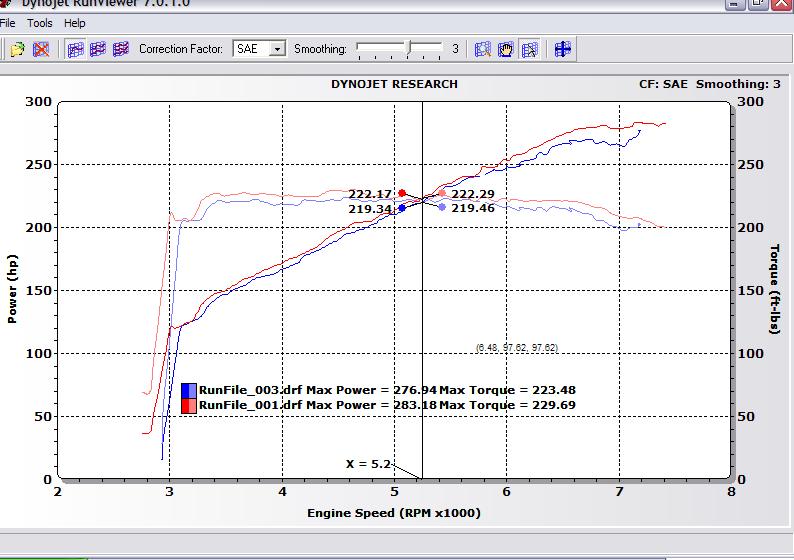
Those data are from the same car in each graph -- not comparing two different cars. The overlay is before and after a given set of mods. Selected points are just showing where greatest gains were.

I'm not making a case for a mean gain of x at datapoint y, I'm showing that a humble change of a filter does indeed net gains throughout the rev range, as shown on two vehicles for which I have data on hand. There's too many transient variables that may affect the magnitude of change at a specific location in the rev range. That we see gains throughout the rev range -- albeit at different points -- on two units is generally good evidence that high flow filters make a positive improvement. Comparing the same car at the same point before and after still provides useful information.
That car A gained 3 whp at 3500 RPM whereas car B gained 5 is not really the issue -- we have no specific hypotheses about that, and again there are too many transient modifiers that will influence things.
Anyway, one shows gains from filters alone the other shows gains from a combo of filters and tubes. The filters alone netted about a 2% gain at 5252 RPM (or as close to it as I could align the cursor) and with both the gain is about 4% when hp and torque are equal.
Here they are again with a single selected RPM point -- 5252 RPM (or as close to it as I could align the cursor)-- for comparison... same day too.
2011 Z

2009 Z

Interpret these data as you will...