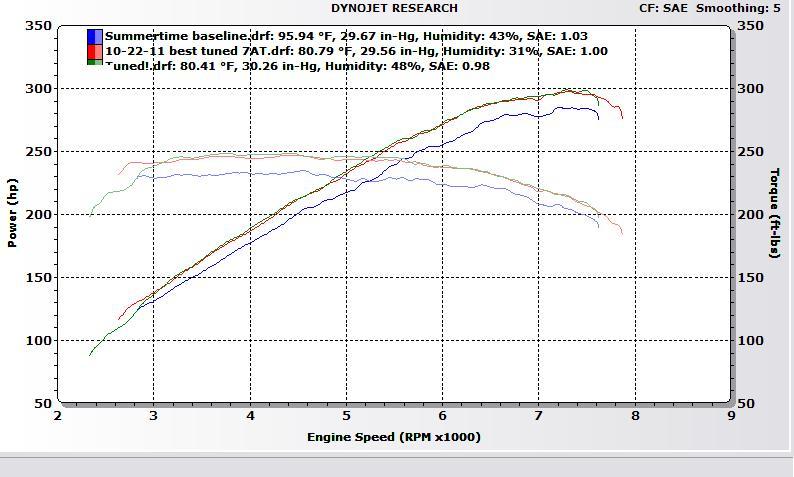
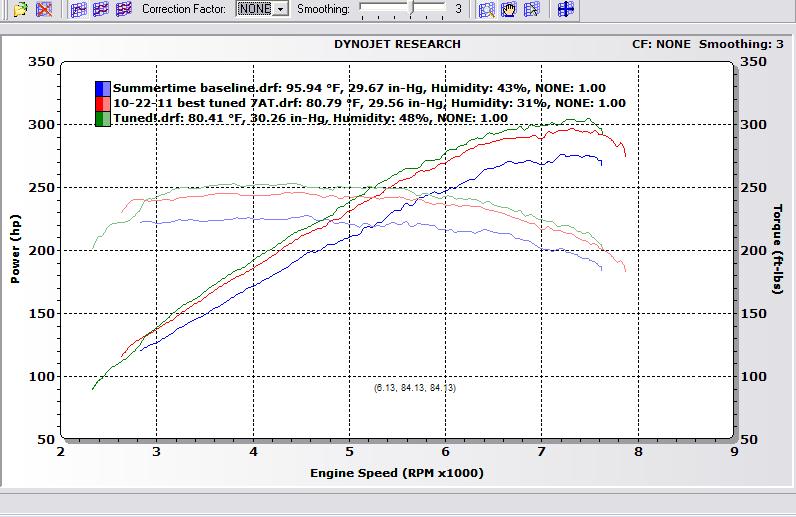
One more set of charts that is very informative -- oberve the effects of heat, humidity, and air pressure on dyno numbers. SAE corrected and uncorrected below.
All of these runs are same car, same mods, same tune, same dyno, but
different times of year -- highest values were obtained in January, next highest and closest was from yesterday (end of October), and lowest was in the dead of summer!
This is Florida... imagine the differences in power over the year in places where they actually have seasons


Oh, and BTW, as you can see, even using a correction factor, you get very different numbers depending on ambient conditions.... something good to keep in mind.